GealogNet – hydrometeorological database with Web interface
GealogNet is our hydrometeorological database for your measurement data.
- Impressively fast database access
- Extensive configuration options for visualization of measurement data on the web.
- Data download in various formats
- extensive user management
- configurable alarms via email or SMS
- The Gealog Image Viewer can be integrated directly into GealogNet
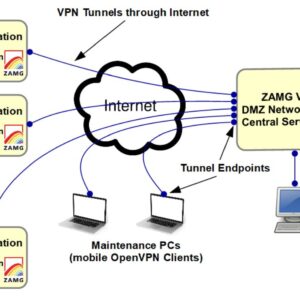
- The database can be used both in the cloud at the GealogNet server and installed as a local solution on your server.
Please visit our demo weather station:
Your access data:
- User: demouser
- Password: passme
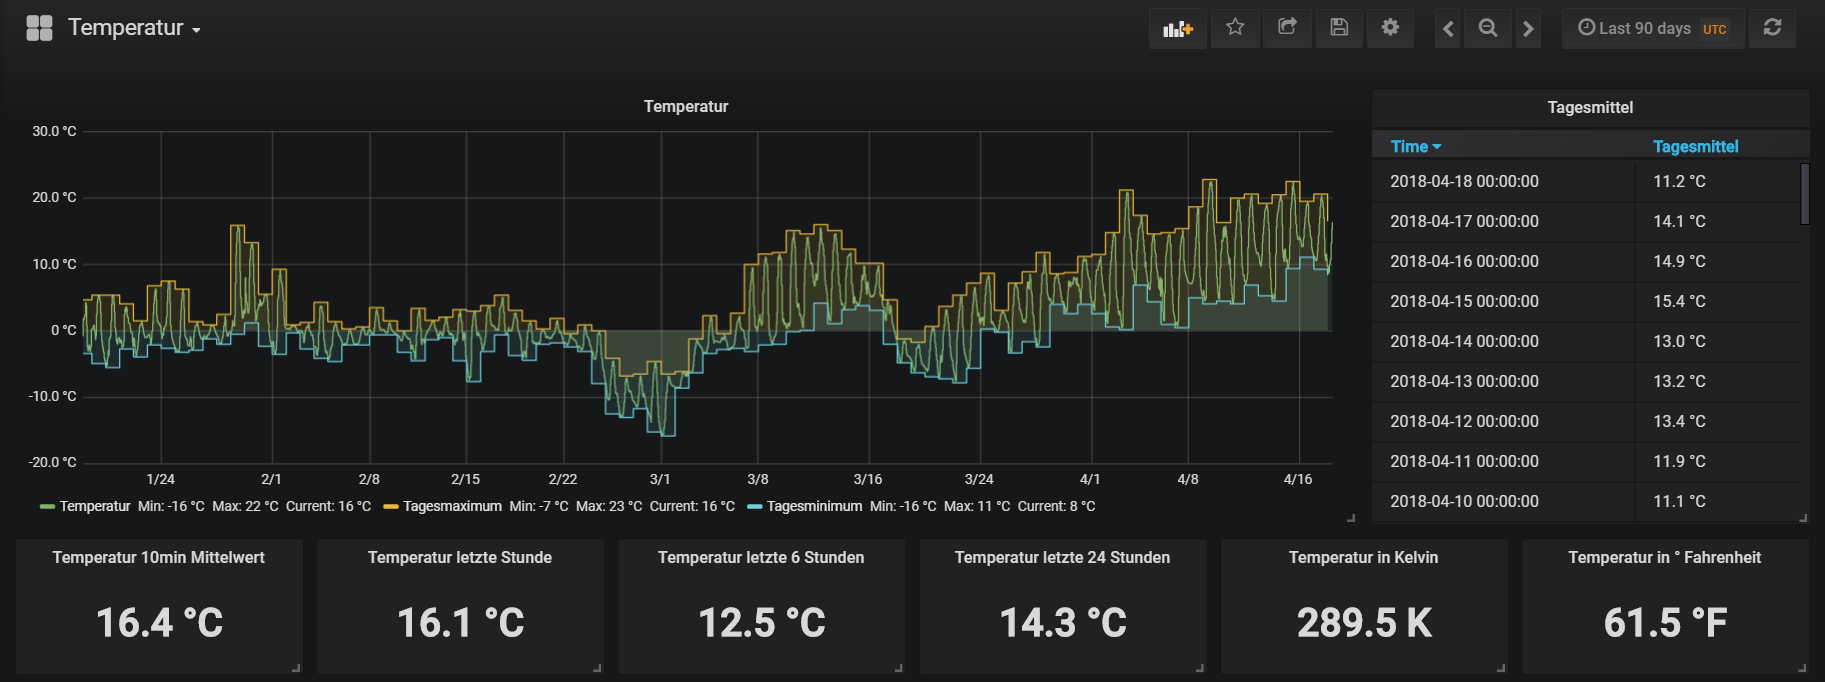
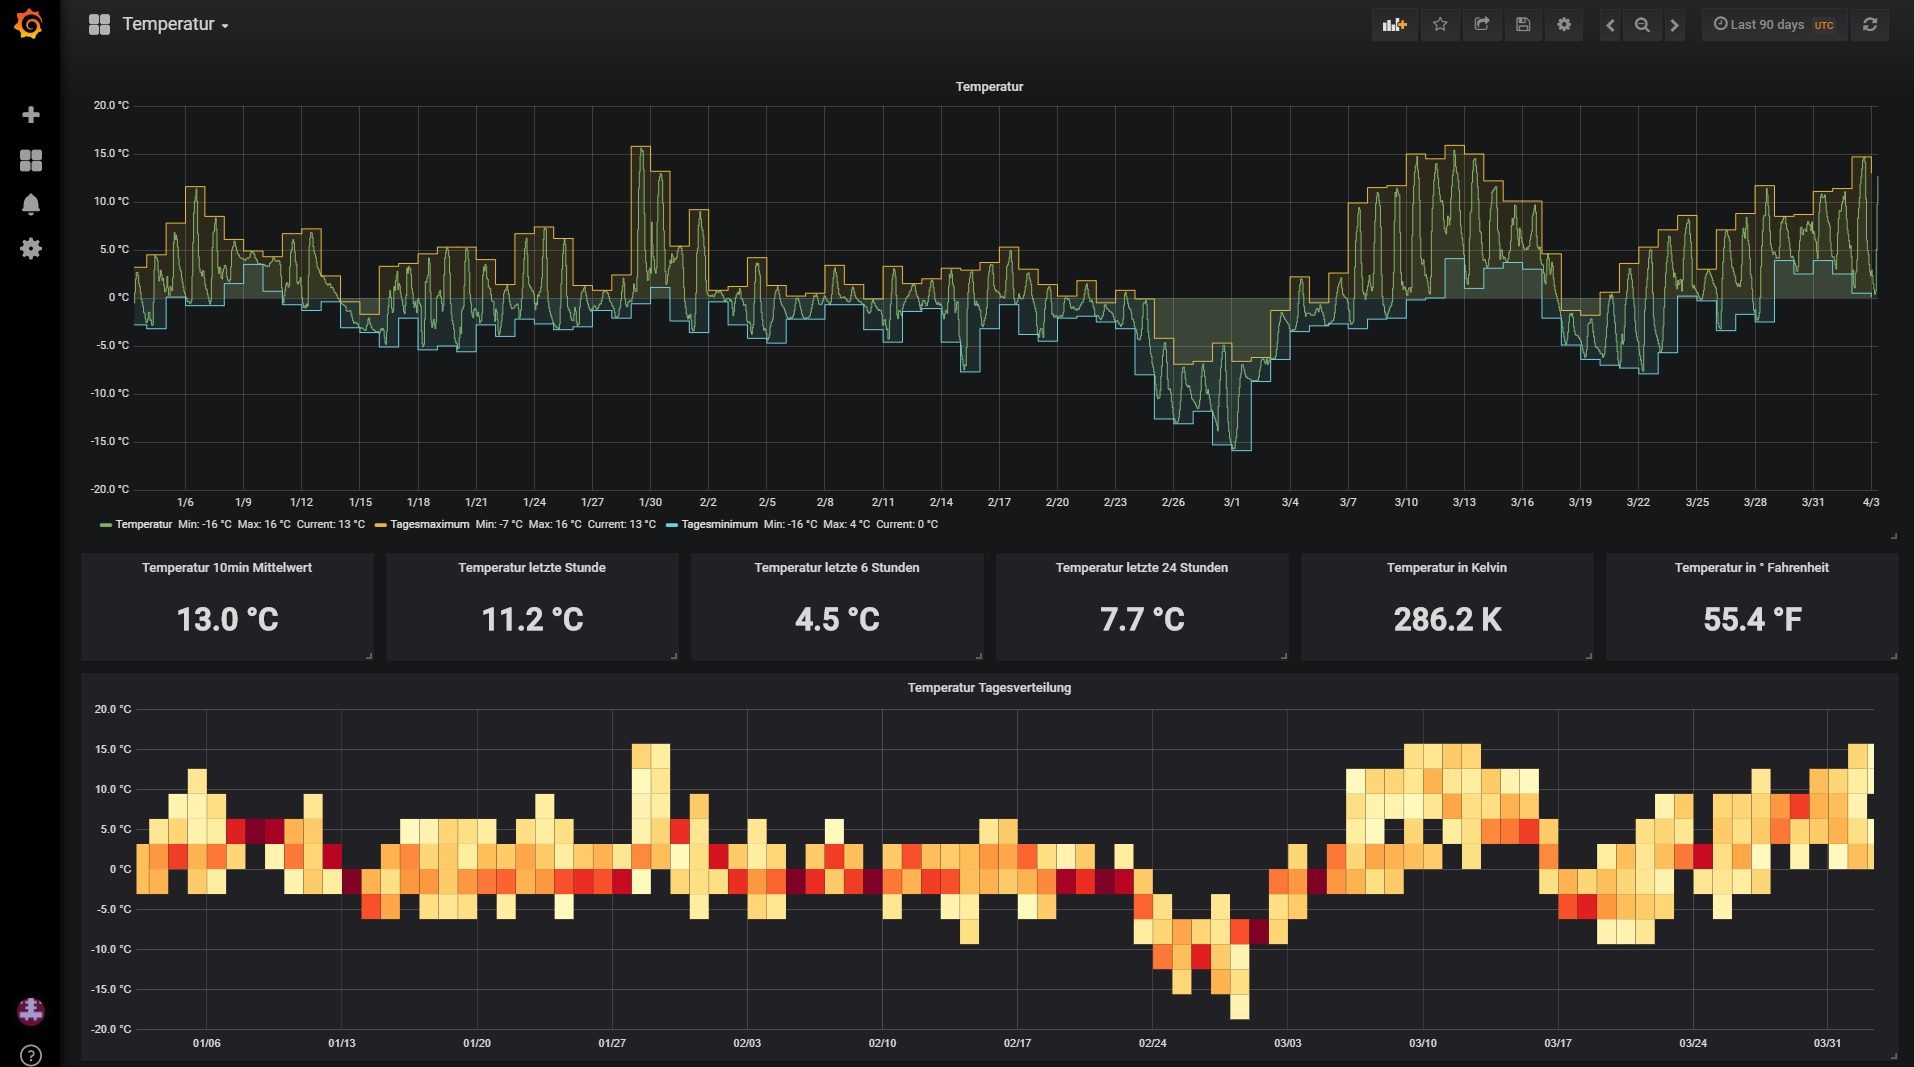
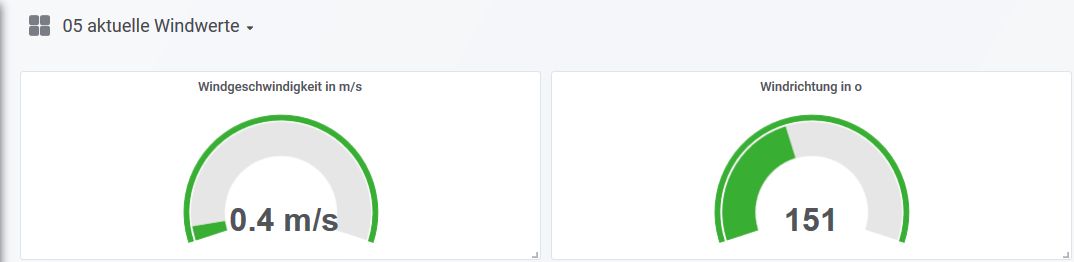
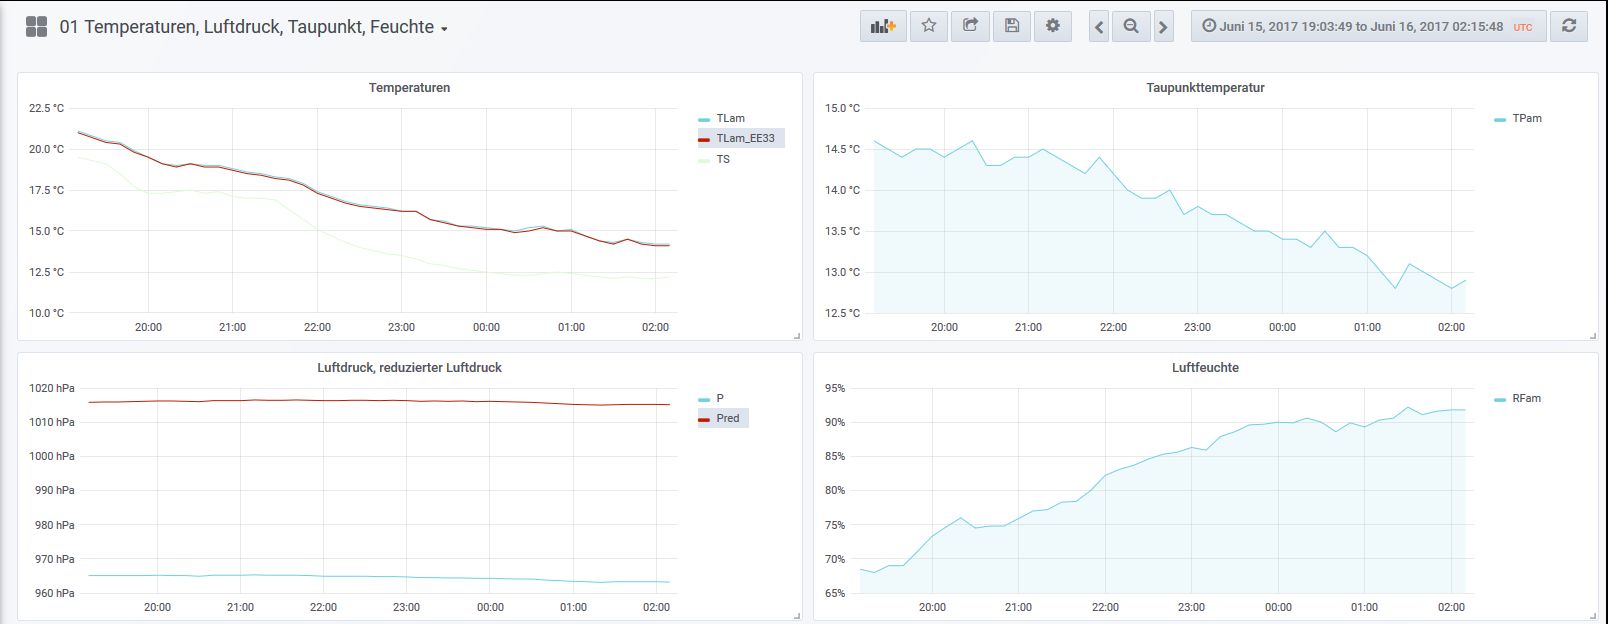
The demo weather station web pages show some possibilities of GealogNet:
- Combination of different types of information on one page: descriptive text, graphics, tables, photos. Google Maps areas can also be easily blended in.
- If you position in a graphic field, you can measure the curve point by point, mouse click and drag in the graphic field activates the zoom function.
- Click on the time range field in the upper right corner opens different possibilities to select the time range of the plots.
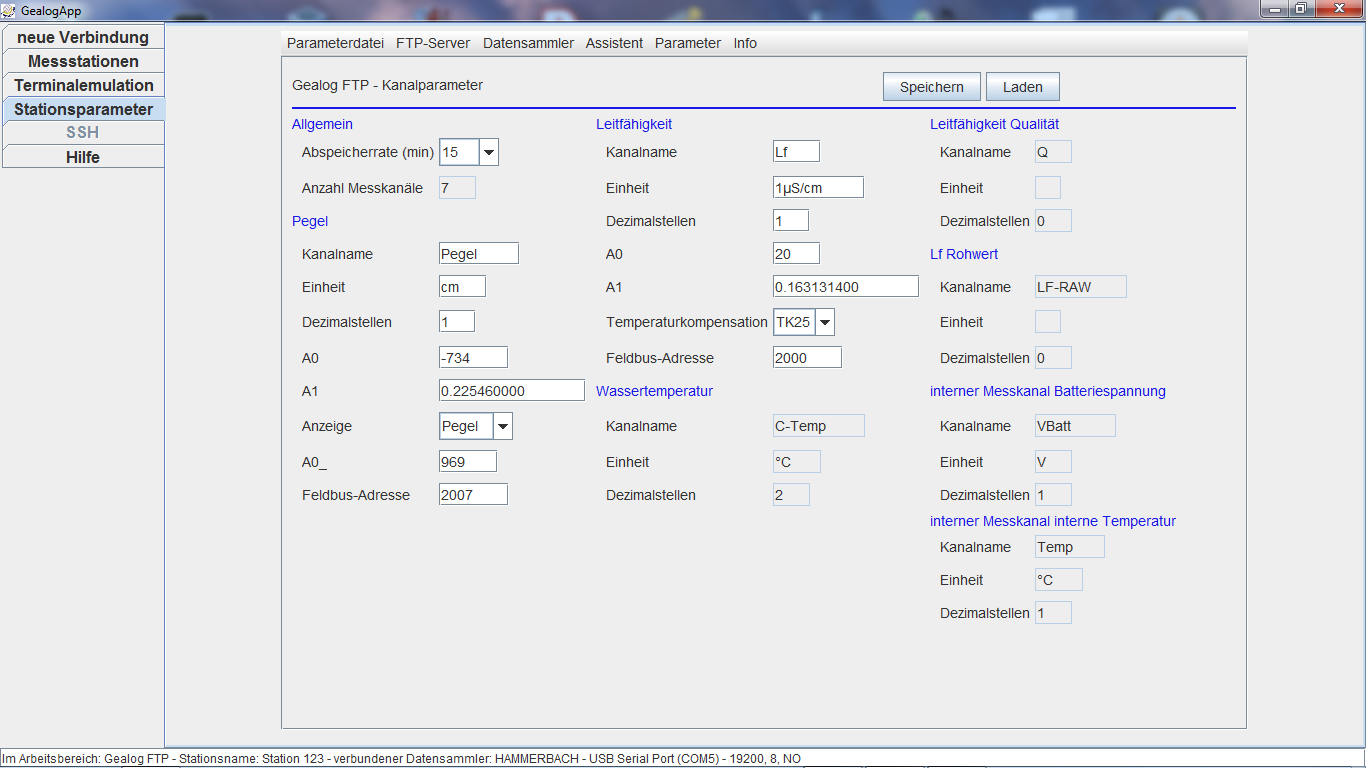
All display options can be freely configured by a user with administrator rights.
If you have any questions about GealogNet, please do not hesitate to contact us.